


Disaster Prevention Integrated Pictogram An integrated disaster-prevention pictogram project combining local elevation data, projected flood levels, and a QR code for hazard maps


- Nationality
- Japan
- Individual
- Noriaki Mori
About Project
The Disaster Prevention Integrated Pictogram is a disaster prevention information design project that integrates information needed to prepare for tsunami and flood risks into a single visual system so that anyone can quickly understand it.
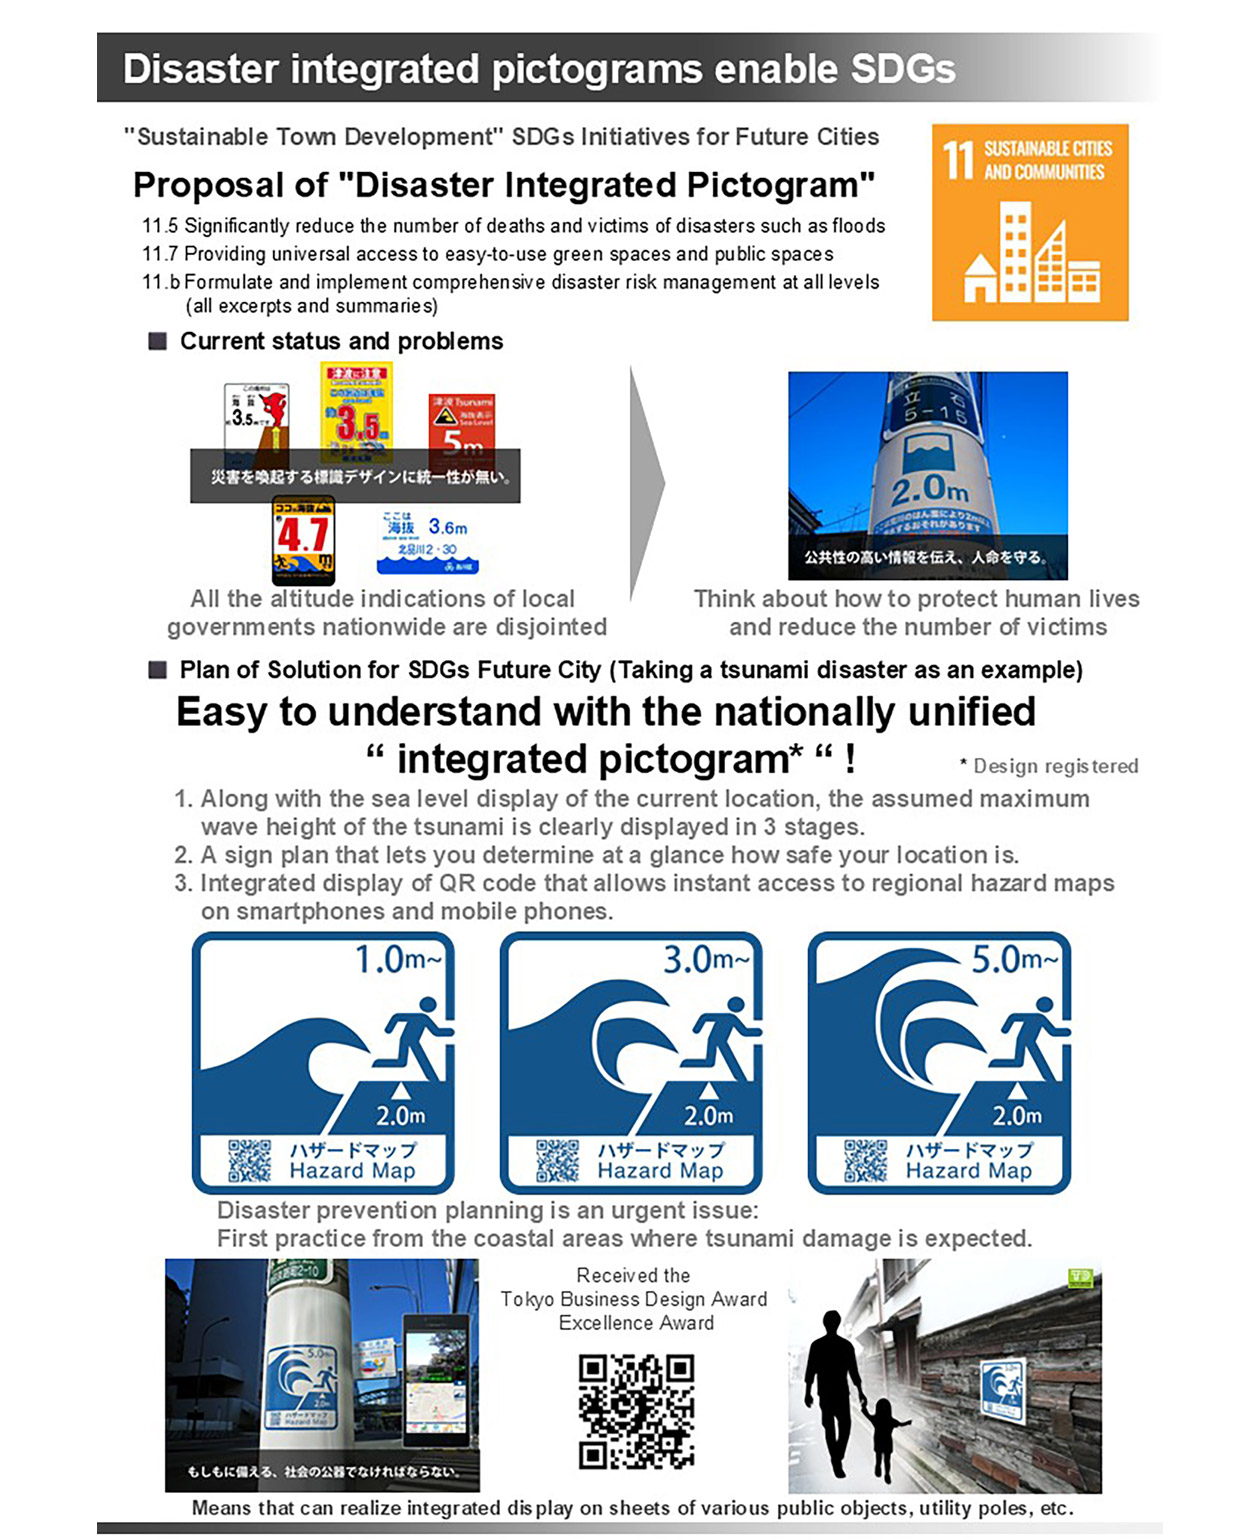
Japan has repeatedly experienced tsunami damage caused by earthquakes, but depending on the region, expected tsunami heights or hazard maps are not sufficiently prepared, and signage systems notifying tsunami risks vary by local government, making it difficult to deliver information consistently. This project developed an integrated pictogram by organizing disaster information that was previously delivered differently across regions into a common visual language, allowing people to clearly check necessary information during normal times as well as when disasters occur.
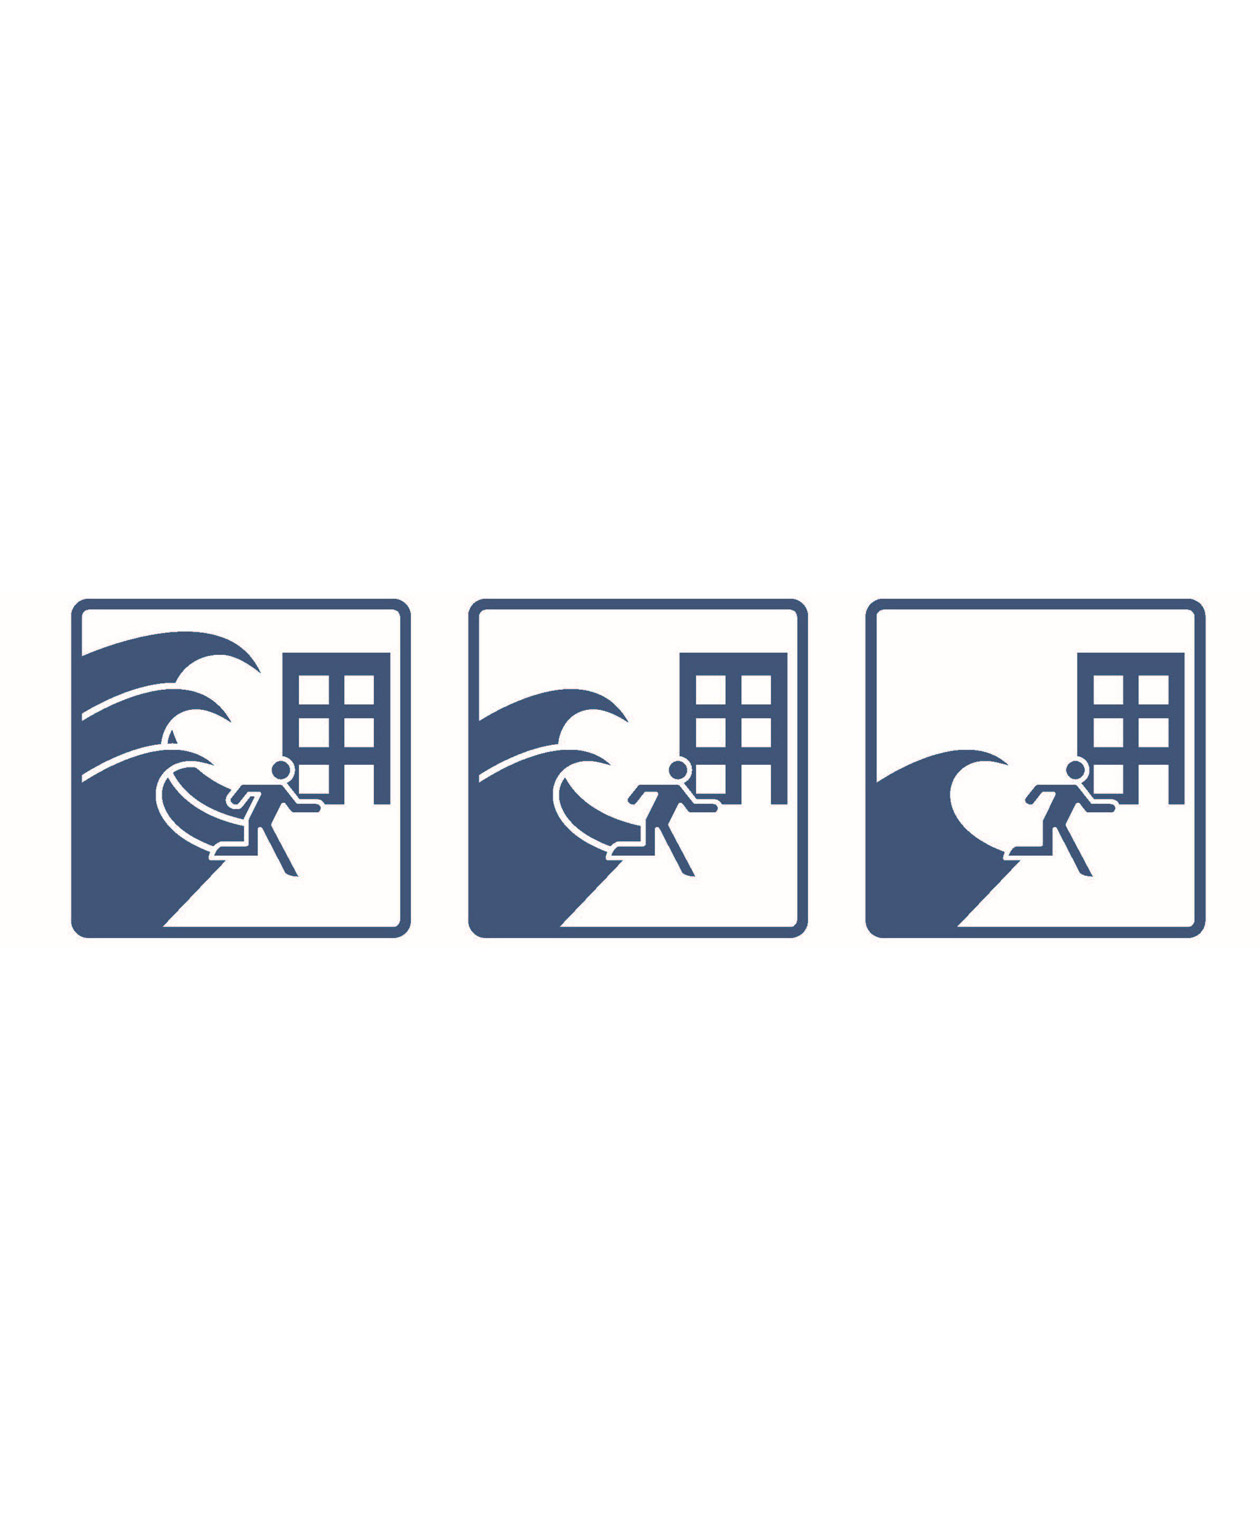
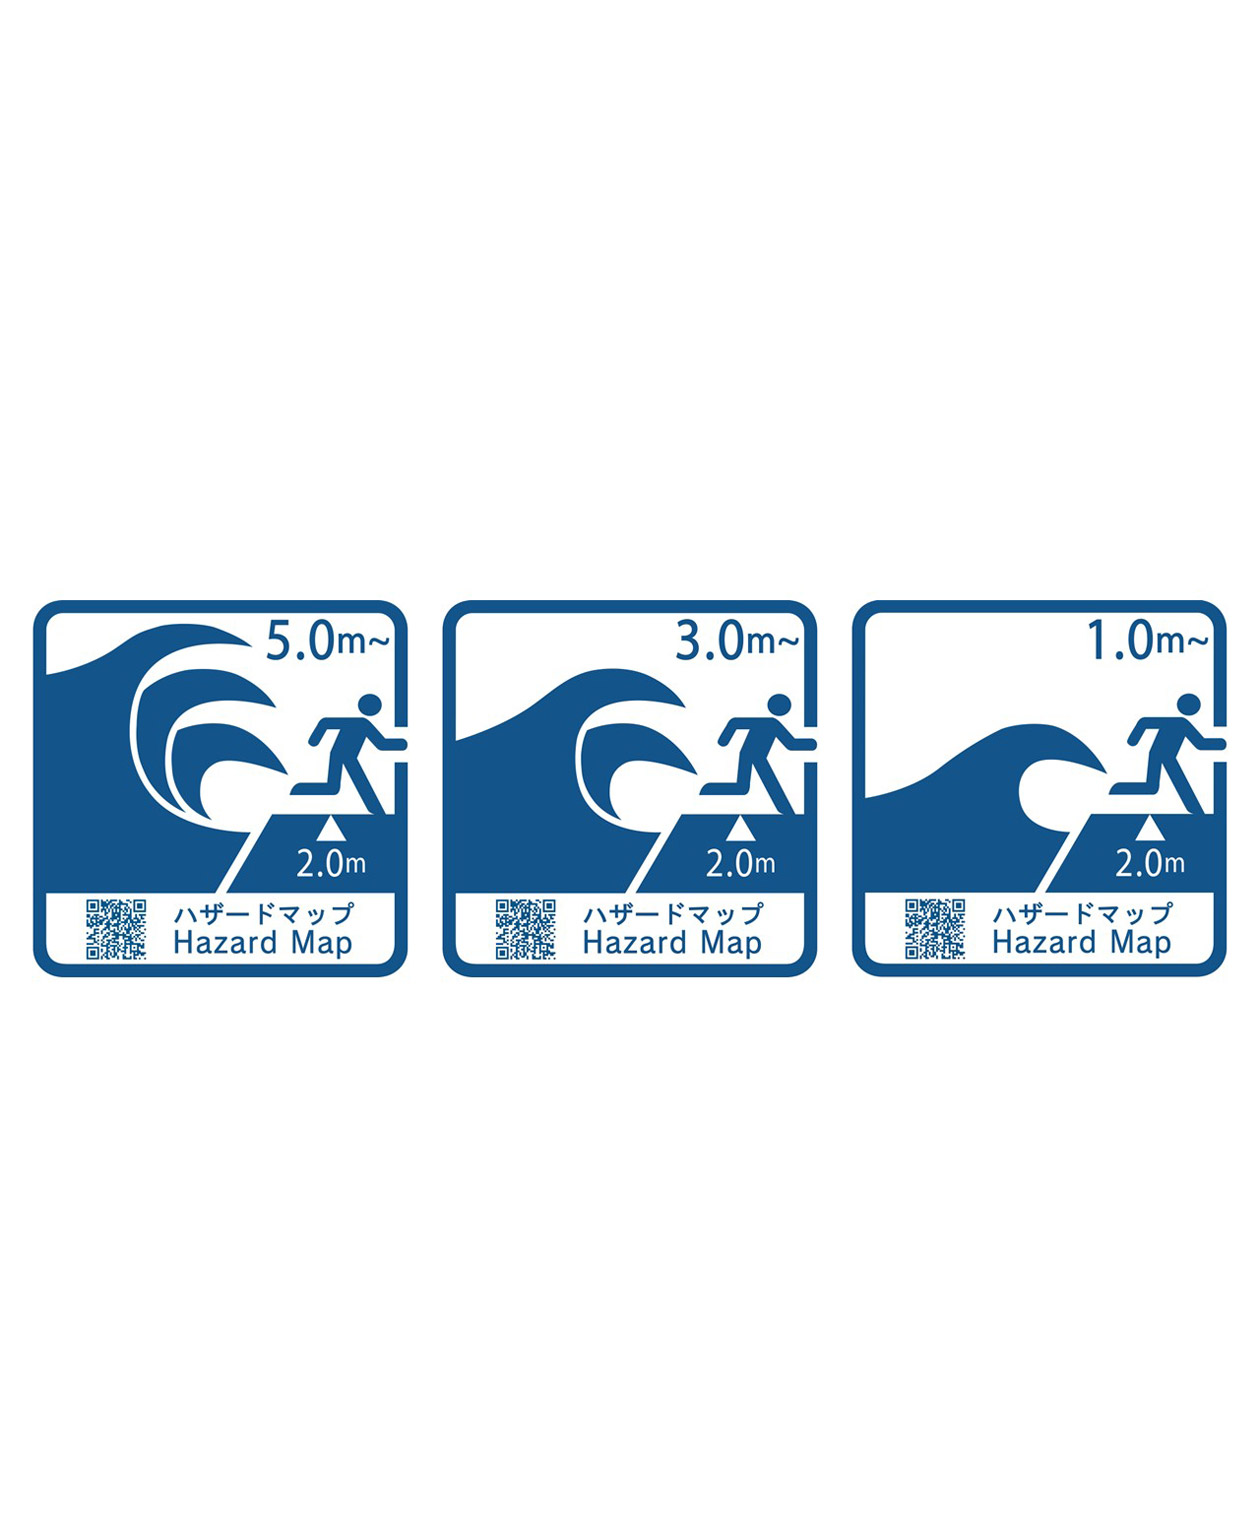
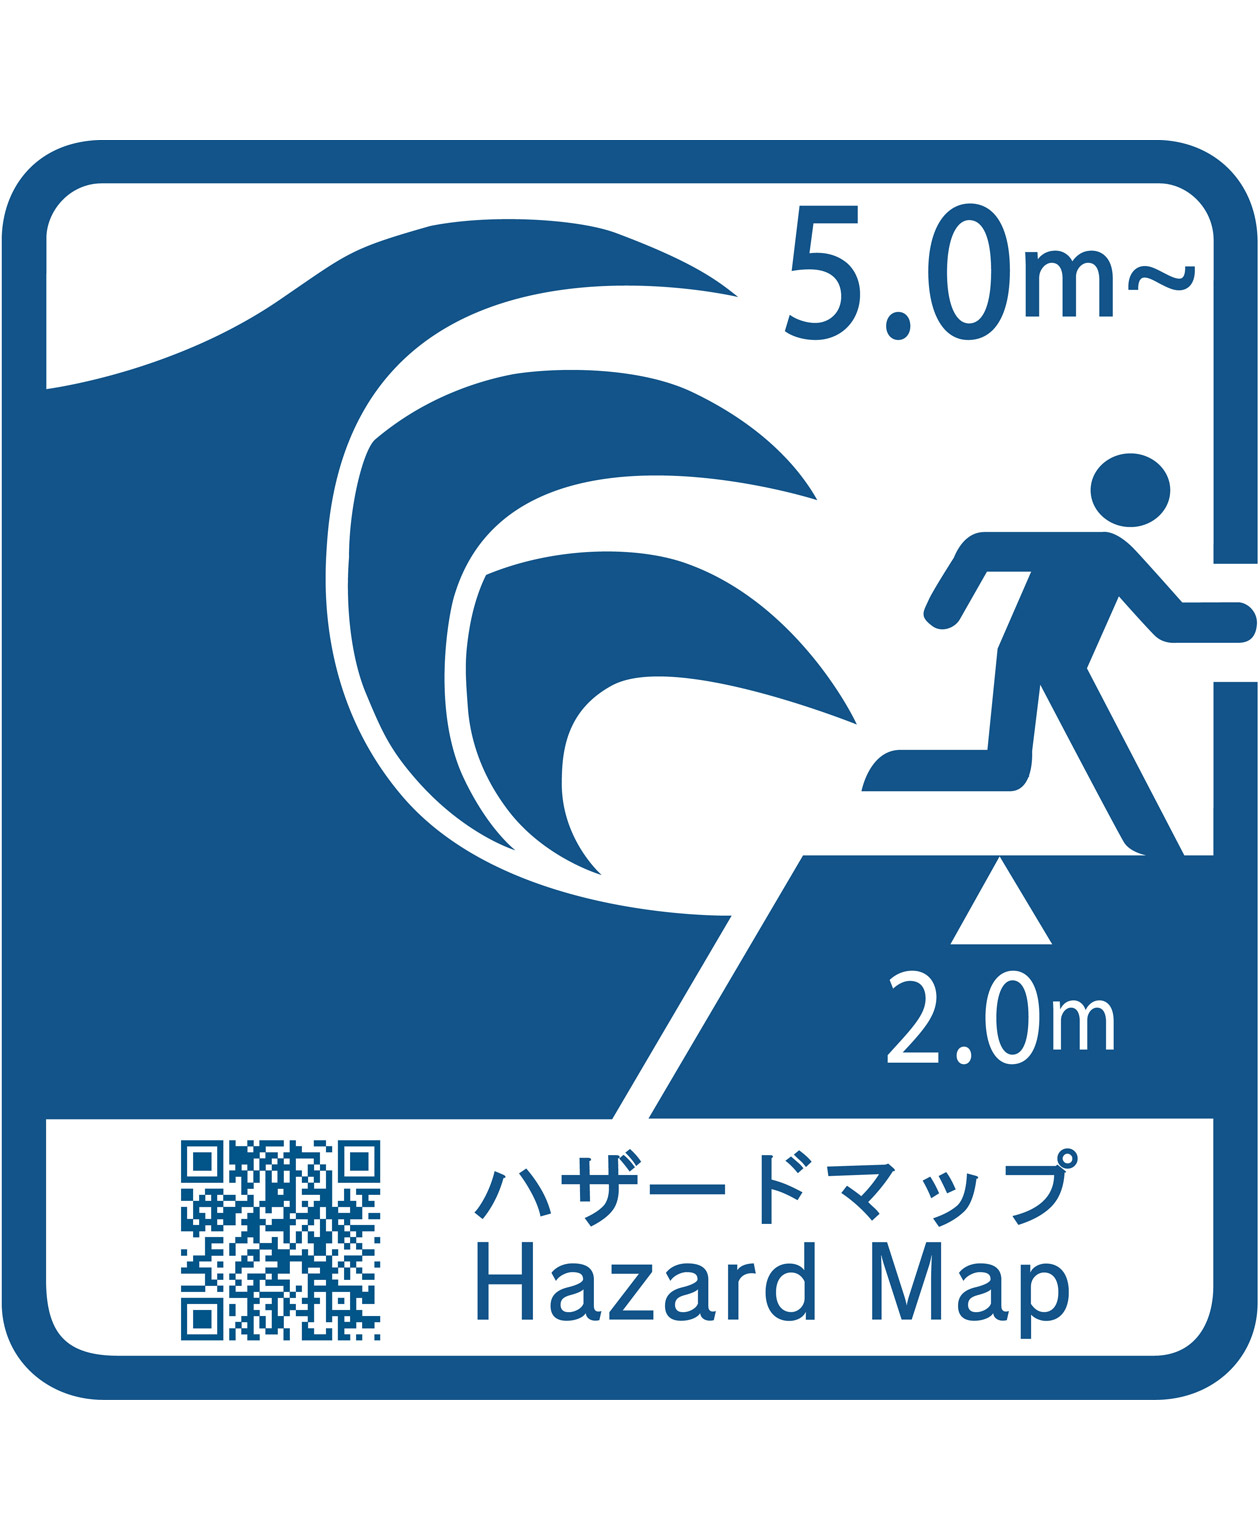
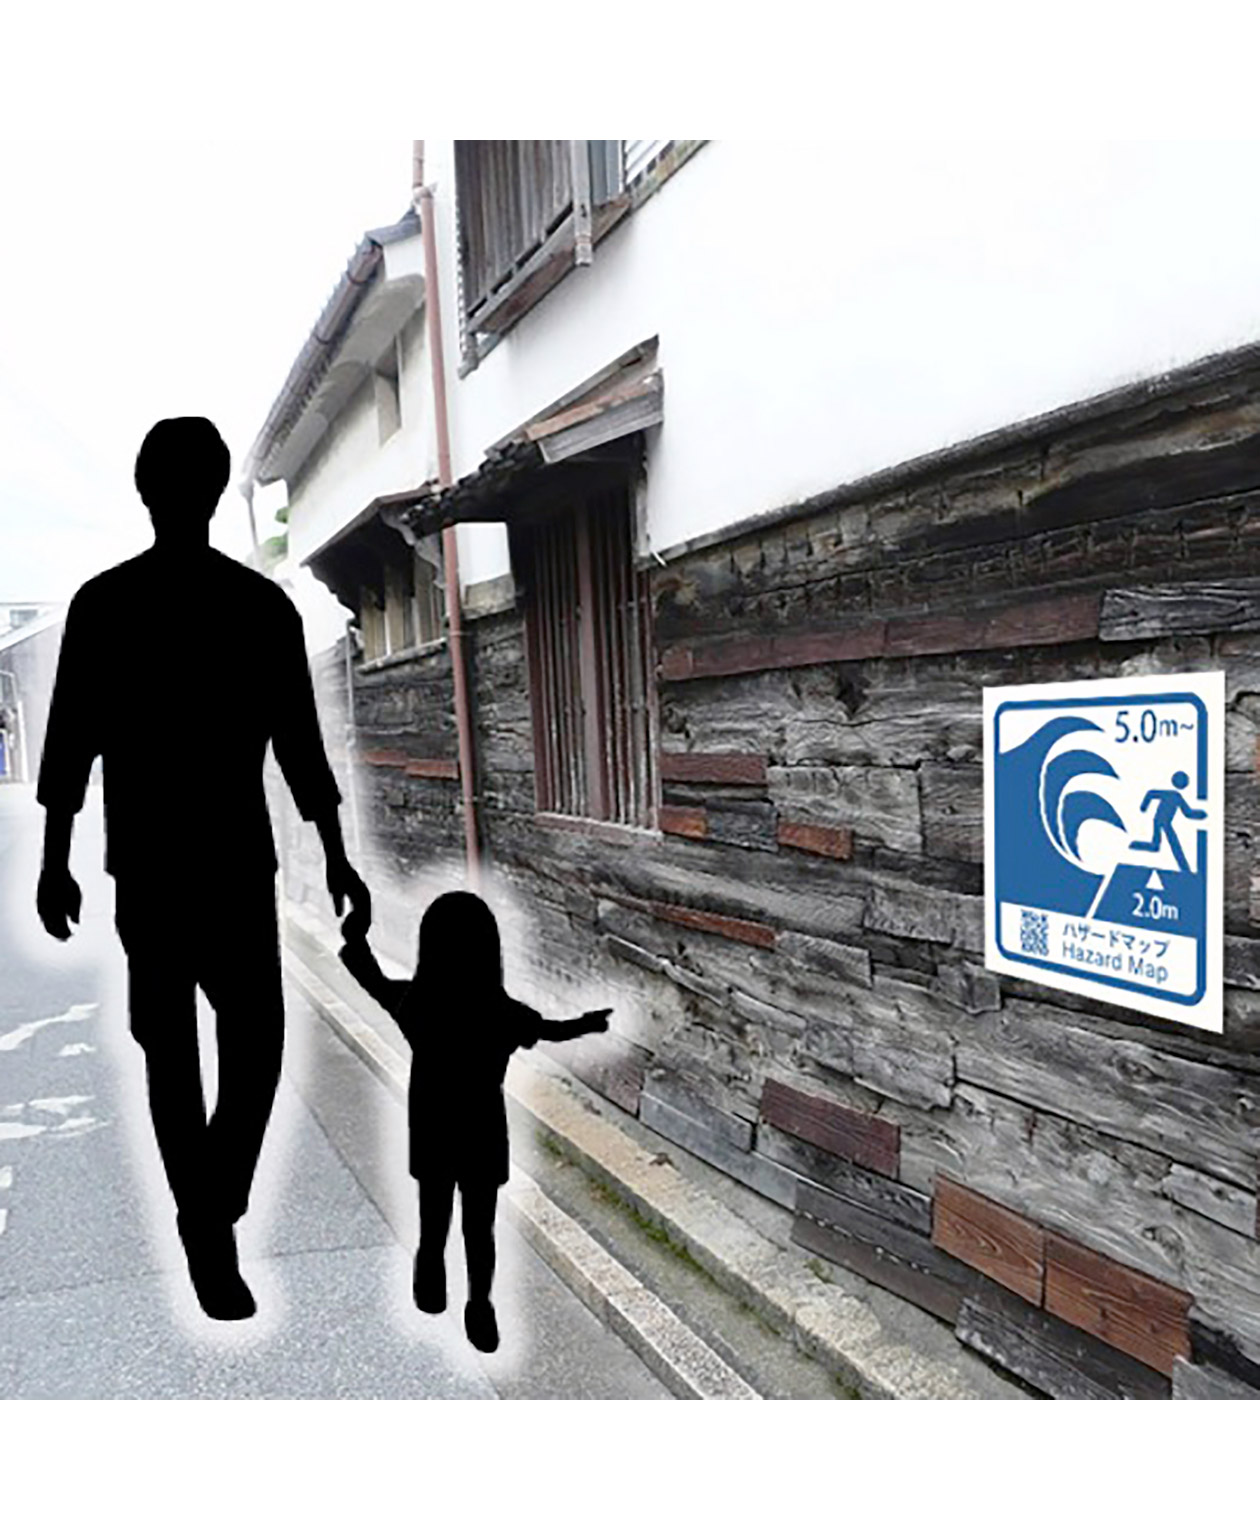
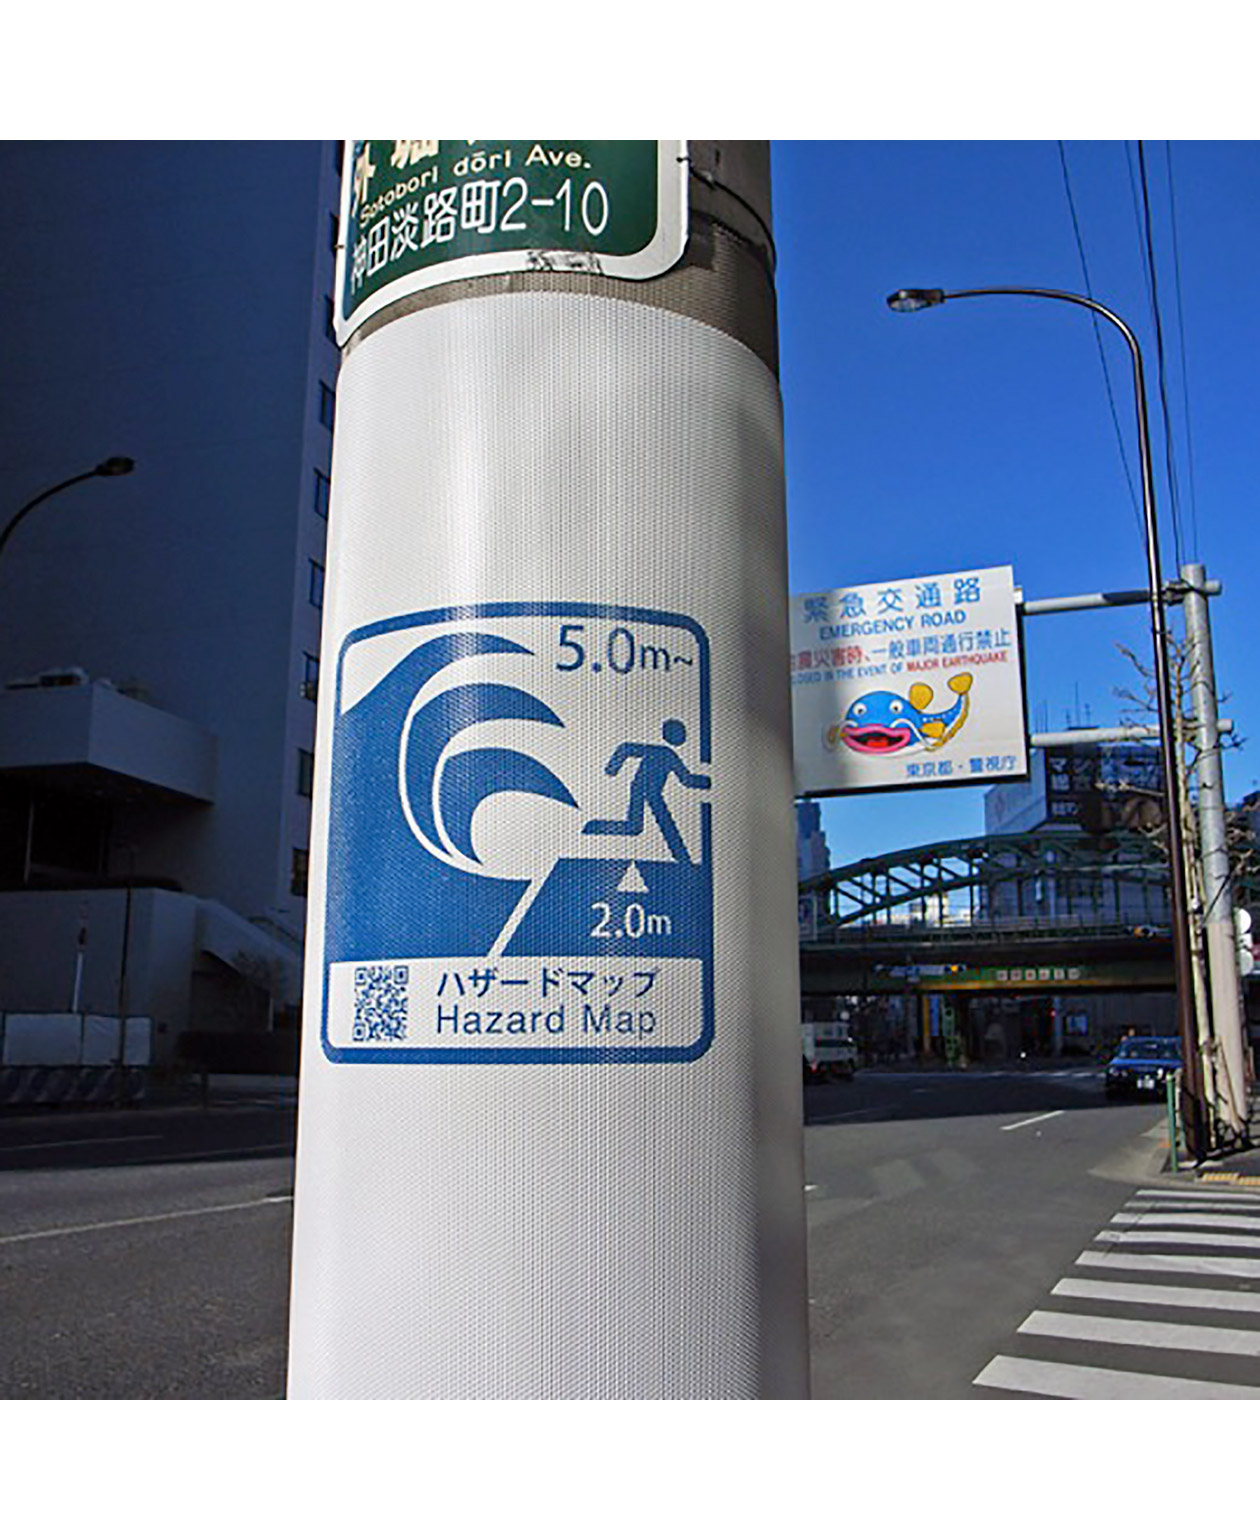
The pictogram displays the elevation of the current location and the expected maximum tsunami height together. Tsunami heights are categorized into three stages: 1 meter or more, 3 meters or more, and 5 meters or more, allowing users to grasp the risk level of their current location at a glance. By using the QR code displayed alongside, users can check the local hazard map and find more specific information such as evacuation locations and routes. It is characterized by configuring an information structure that allows intuitive comparison of risk levels and an access approach leading to digital information within a single sign.
The use of text was minimized to convey information as concisely and clearly as possible. Only the expression “Hazard Map” is written in both the local language and a major second language, while the rest of the information is structured around simple icons. This is to ensure that people who have difficulty decoding text or who speak different languages can quickly understand risk information. It was designed from the beginning as a visual system with low language dependency so that it can be used not only in Japan but also in various regions around the world facing tsunami and flood risks.
The core is not just notifying the risk, but leading it to the next action. By comparing the elevation of the current location with the expected tsunami height to instantly check the risk level, and checking the local hazard map via the QR code, users can determine where to evacuate. By organizing the priority of information, it visually connected the flow of user behavior leading to 'risk perception - information confirmation - evacuation judgment'.
This approach helps people recognize and prepare for risks in their living areas not only at the moment of a disaster but also in daily life. By installing easily understandable pictograms in everyday urban environments, it raises awareness of potential tsunami and flood risks and encourages people to check evacuation methods in advance. This connects with the safe and resilient living environment aimed at by Goal 11 of the United Nations Sustainable Development Goals (SDGs): “Sustainable Cities and Communities”
Within Japan, issues regarding the lack of an integrated and standardized disaster prevention signage system are being raised, and disaster research institutes and multiple local governments are paying attention to the necessity of clearer and easier-to-understand information delivery methods. This project addresses this problem by proposing a common information design system that can be utilized across different regions.
As responses to various flood risks such as floods as well as tsunamis become important due to climate change, this pictogram was designed from the beginning to be utilized across multiple countries and media platforms. Simple-shaped icons were applied so that they can be used not only in real-space signage but also in digital environments such as social media and smartphone applications. It is a visual system considering scalability to deliver the same information even when languages and media change.
In the past in Japan, records of large-scale tsunamis and floods were carved into cliffs or stone monuments to warn future generations of the danger. This project aims to convert such disaster memories and information into a visual language suited for today's environment, creating an integrated disaster information system that can be utilized beyond regions and languages.